Introduction
Mainframes, such as IBM z/OS, are still operating in many large corporations and will probably continue to do so for the foreseeable future.
Mainframe file systems contain huge amounts of data that are still waiting to be unlocked and made available to modern applications.
Traditionally, mainframe data is processed by batch programs often written in COBOL. Usually several batch programs are organized as sequential steps in a flow. On z/OS, the flow description language is JCL, a rather complex and proprietary language.
Assuming you would like to exploit mainframe data but would rather not write COBOL or JCL, this article shows an approach harnessing the power of ETL tools such as Pentaho Data Integration. With this type of solution, mainframe data can be made available to a very large and growing set of technologies.
The primary destination of mainframe data is BI systems, data warehouses and so forth. Such systems impose constraints on data models in order to achieve the usability and performance levels that users expect when they run complex queries. Mainframe data on the other hand, being optimized for OLTP activity and storage optimization, is rarely organized in a BI friendly way. Hence the need to transform it.
In this article we will walk you through a rather common use case where mainframe data is optimized to reduce storage and needs to be normalized with the help of ETL technology.
While this type of transformation has been possible in the past, the novelty here is that we can now achieve identical results for a fraction of the cost, using Open Source technologies.
Use case
In our use case the source data is stored in a mainframe sequential file (QSAM in mainframe parlance).
Records in such files are not delimited by a special character, such as carriage return or line feed, as is common on distributed systems. Furthermore, a record content is a mix of characters and non-characters. Characters are usually encoded in EBCDIC, while non-characters represent various forms of numeric data. Numeric data is often encoded in mainframe specific formats such as compressed numerics (COMP-3).
Mainframe file records are often variable in size. This was important to save storage resources at a time when these were very expensive.
Although there are yet more difficulties involved in interpreting mainframe data, it should be clear by now that you can’t do so without some meta data that describes records. On mainframes, such metadata is often a COBOL copybook. A copybook is a fragment of COBOL code that describes a data structure (very similar to a C structure). This is a sample of such a copybook we will be using as a use case:
       01  CUSTOMER-DATA.
           05 CUSTOMER-ID                    PIC 9(6).
           05 PERSONAL-DATA.
              10 CUSTOMER-NAME               PIC X(20).
              10 CUSTOMER-ADDRESS            PIC X(20).
              10 CUSTOMER-PHONE              PIC X(8).
           05 TRANSACTIONS.
              10 TRANSACTION-NBR             PIC 9(9) COMP.
              10 TRANSACTION OCCURS 0 TO 5
                 DEPENDING ON TRANSACTION-NBR.
                 15 TRANSACTION-DATE         PIC X(8).
                 15 TRANSACTION-AMOUNT       PIC S9(13)V99 COMP-3.
                 15 TRANSACTION-COMMENT      PIC X(9).
Things to notice about this record description are:
- This is 5 levels deep hierarchy
- PIC X(n) denotes text fields containing EBCDIC encoded characters
- CUSTOMER-ID, TRANSACTION-NBR and TRANSACTION-AMOUNT are 3 different forms of numerics
- The array described with OCCURS and DEPENDING ON is a variable size array whose actual size is given by the TRANSACTION-NBR variable.
Now assuming we take a peek, with an hexadecimal editor, at a file record containing data described by this COBOL copybook, we would see something like this:
    00000000h: F0 F0 F0 F0 F0 F1 C2 C9 D3 D3 40 E2 D4 C9 E3 C8 ;
    00000010h: 40 40 40 40 40 40 40 40 40 40 C3 C1 D4 C2 D9 C9 ;
    00000020h: C4 C7 C5 40 40 40 40 40 40 40 40 40 40 40 F3 F8 ;
    00000030h: F7 F9 F1 F2 F0 F6 00 00 00 00                   ;
This first record size is only 58 bytes long. This is because the TRANSACTION-NBR field contains a value of zero, hence there are no array items stored.
The second record though, which starts at offset 59, looks like this:
    0000003ah: F0 F0 F0 F0 F0 F2 C6 D9 C5 C4 40 C2 D9 D6 E6 D5 ;
    0000004ah: 40 40 40 40 40 40 40 40 40 40 C3 C1 D4 C2 D9 C9 ;
    0000005ah: C4 C7 C5 40 40 40 40 40 40 40 40 40 40 40 F3 F8 ;
    0000006ah: F7 F9 F1 F2 F0 F6 00 00 00 04 F3 F0 61 F1 F0 61 ;
    0000007ah: F1 F0 00 00 00 00 00 03 68 2C 5C 5C 5C 5C 5C 5C ;
    0000008ah: 5C 5C 5C F3 F0 61 F1 F0 61 F1 F0 00 00 00 00 00 ;
    0000009ah: 17 59 3C 5C 5C 5C 5C 5C 5C 5C 5C 5C F3 F0 61 F1 ;
    000000aah: F0 61 F1 F0 00 00 00 00 00 11 49 2C 5C 5C 5C 5C ;
    000000bah: 5C 5C 5C 5C 5C F1 F0 61 F0 F4 61 F1 F1 00 00 00 ;
    000000cah: 00 00 22 96 5C 5C 5C 5C 5C 5C 5C 5C 5C 5C       ;
This one is 158 bytes long because the TRANSACTION-NBR field contains a value of 4. There are 4 items in the variable size array.
As you can see, there is not a single byte of excess storage in that file!
Now let us assume this file was transferred in binary mode to our workstation and that we want to create an excel worksheet out of its content.
Building a simple PDI Transform
To transform the mainframe file into an Excel worksheet, we will be using Pentaho Data Integration (PDI) and the LegStar plugin for PDI. LegStar for PDI provides the COBOL processing capabilities that are needed to transform the mainframe data into PDI rows.
The PDI community edition product is open source and freely available from this download link. This article was written using version 4.1.0.
LegStar for PDI is also an open source product, freely available at this download link. For this article, we used release 0.4.
Once you download legstar-pdi, you need to unzip the archive to the PDI plugins/steps folder. This will add the z/OS File Input plugin to PDI standards plugins.
The PDI GUI designer is called Spoon, it can be started using the spoon.bat or spoon.sh scripts.
On the first Spoon screen we create a new Transformation (using menu option File→New→Transformation).
From the designer palette’s Input folder, we drag and drop the z/OS file input step:
This will be the first step of our transformation process. Let us double click on it to bring up the settings dialog:

On the File tab, we pick up the z/OS binary File which was transferred to our workstation. Since this is a variable length record file, we check the corresponding box on the dialog.
This file does not contain record descriptor words. RDWs are 4 bytes that z/OS adds to each variable record. When these are present, LegStar can more efficiently process the file.
The z/OS character set is the EBCDIC encoding used for text fields. For french EBCDIC for instance, with accented characters and Euro sign, you would pick up IBM01147.
We now select the COBOL tab and copy/paste the COBOL structure that describes our file records:

At this stage, we need to click the Get Fields button which will start the process of translating the COBOL structure into a PDI row.
A PDI row is a list of fields, similar to a database row. The row model is fundamental in ETL tools as it nicely maps to the RDBMS model.
The Fields tab shows the result:

As you can see, several things happened:
- The COBOL hierarchy has been flattened (LegStar has a name conflict resolution mechanism)
- Data items, according to their COBOL type, have been mapped to Strings, Integers or BigNumbers with the appropriate precision
- The array items have been flattened using the familiar _n suffix where n is the item index in the array
We are now done with setting up the z/OS file input step but before we continue building our PDI Transformation, it is a good idea to use one of the great features in PDI, which is the Preview capability. The Preview button should now be enabled, if you click on it and select a number of rows you would like to preview, you should see this result:

Time to go back to the PDI Transformation, add an Excel output step and create a hop between the z/OS file input step and the Excel output step:

You can now run the Transformation, this will require that you save your work. In our case we named our Transformation rcus-simple.ktr. Ktr files are XML documents that completely describe the PDI Transformation.
There is a launch dialog on which we simply chose to click launch and then the result showed up as this:

As you can see, 10000 records were read off the z/OS file and an identical number of rows were written in the Excel worksheet (plus a header row).
It is time to take a look at the Excel worksheet we created:

Everything is in there but you might notice the variable size array results in a lot of oolumns and a lot of empty cells since we need to fill all columns. Indexed column names and sparsely filled cells result in a worksheet that is hard to play with.
This reveals the fundamental issue with mainframe data models, they were not intended for end users to see. So putting such raw data in an excel worksheet is unlikely to be satisfactory.
This is where ETL tools take all their meaning. To illustrate the point we will next enhance our transformation to get rid of the variable size array effect.
Enhancing the PDI Transformation
Our first enhancement it to reduce the number of columns. We will apply a normalization transformation that is best described with an example.
This is a partial view of our current result row:
| CustomerId | CustomerName | … | TransactionAmount_0 | TransactionAmount_1 | TransactionAmount_2 | TransactionAmount_3 | … |
|---|---|---|---|---|---|---|---|
| 2 | FRED BROWN | … | 36,82 | 175,93 | 114,92 | 229,65 | … |
The COBOL array flattening has had the effect of multiplying the number of columns. Here would be a more desirable, normalized, view of that same data:
| CustomerId | CustomerName | … | TransactionIdx | TransactionAmount | … |
|---|---|---|---|---|---|
| 2 | FRED BROWN | … | 0 | 36,82 | … |
| 2 | FRED BROWN | … | 1 | 175,93 | … |
| 2 | FRED BROWN | … | 2 | 114,92 | … |
| 2 | FRED BROWN | … | 3 | 229,65 | … |
What happened here is that Columns were traded for Rows. Instead of 5 TransactionAmount_n columns there is a single one and the new TransactionIdx column identifies each transaction. The result is a normalized table in the sense of the first normal form in RDBMS theory.
Normalizing has an effect on volumes of course but the result is much easier to manipulate with traditional RDBMS semantics.
Let us now modify our PDI Transformation and introduce a Normalizer step (Palette’s Transform category):

Setting up the Normalizer involves specifying the new TransactionIdx column and then mapping the indexed columns to a TransactionIdx value and the single column that will replace each repeatable group:

If we now run our transformation, this is how the result looks like:

This is already much nicer and easier to manipulate. From the original 20 columns, we are now down to 9.
The PDI execution statistics should show that 50000 rows were created in the Excel worksheet out from the 10000 that we read from the z/OS file. This is an negative effect of normalizing that we should now try to alleviate.
You might notice that the Excel worksheet still contains a large number of empty cells corresponding to empty transactions.
Our next step will be to get rid of these empty transactions. For that purpose, we will use the PDI Filter Rows step (under the palette’s Flow category).
The Filter step will be setup to send empty transaction rows to the trash can and forward rows with transactions to the Excel worksheet. The PDI equivalent of a trash can is the Dummy step, also found under the Flow category so we go ahead an add it to the canvas too:

Let us now double click on the Filter step to bring up the setting dialog:
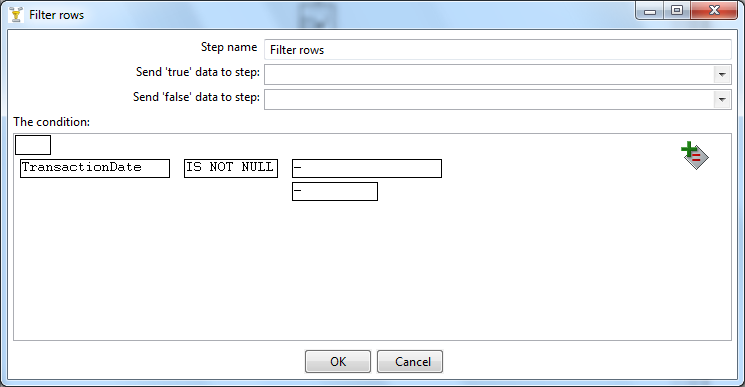
Here we specify that the filter condition is true if the TransactionDate column is not empty. Back to the canvas, we can now create 2 hops, one for the true condition that will lead to the Excel worksheet and one for the false condition which brings to the Dummy step:

We are now ready to execute the PDI Transformation. The metrics should display something like this:

Now, only 25163 rows made it to the Excel worksheet while 24837 were trashed. The resulting Excel worksheet is finally much closer to what an end user might expect:

Conclusion
In this article we have seen how mainframe data, which is by construct obscure and hardly usable by non-programmers, can be transformed into something as easy to manipulate as an Excel worksheet.
Of course, the example given remains simplistic compared to true life COBOL structures and mainframe data organizations but we have seen a small part of the PDI capabilities, some of which are pretty powerful.
Historically the type of features that you have seen in this article were only available from very expensive and proprietary products. The fact that you can now do a lot of the same things, entirely with open source software, will hopefully trigger many more opportunities to exploit the massive untapped mainframe data.
We hope that readers with mainframe background, as well as readers with open systems background, will find this useful and come out with new ideas for Open Source mainframe integration solutions.